
Blog
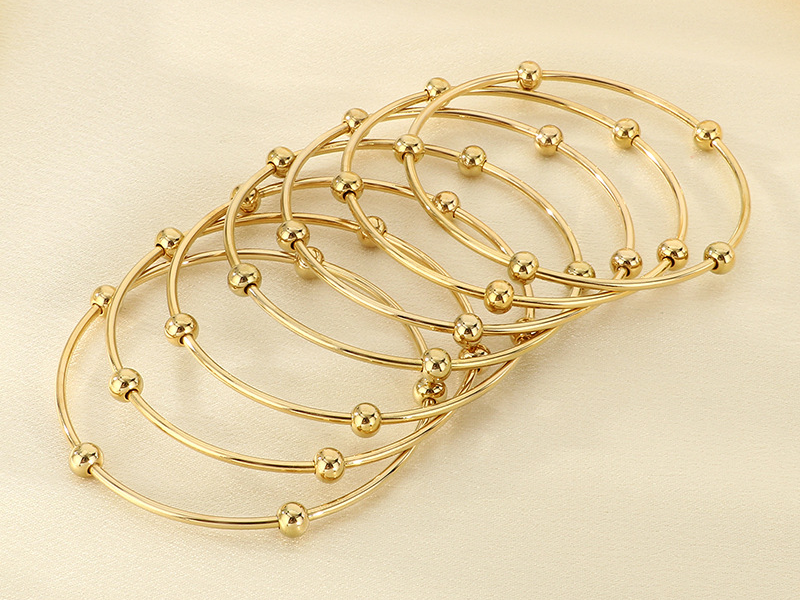
Permanent-Shine Gold Jewelry for Wholesalers—Marketing Myth or Measurable Fact?
Permanent-Shine Gold Jewelry for Wholesalers—Marketing Myth or Measurable Fact?
Problem: clients return dull pieces, profits shrink, staff spend hours polishing.
Agitate: I once wrote off an entire coastal boutique order after 60 days of shelf corrosion.
Solve: I switched to certified non-tarnish coatings and tied every batch to ASTM test data.
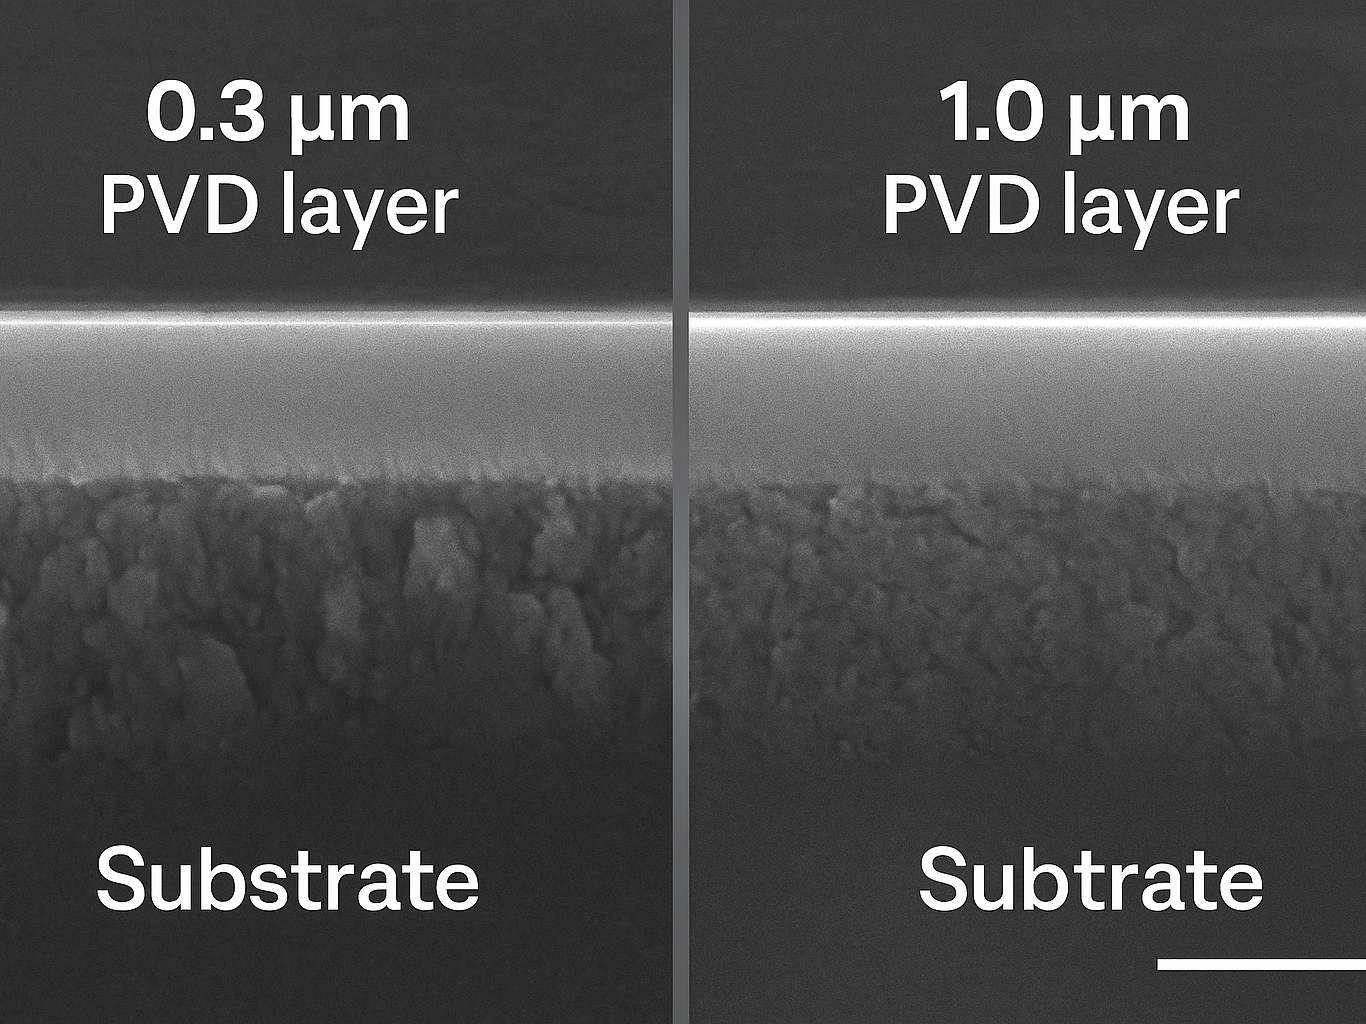
True non-tarnish gold uses thick PVD or noble-alloy fusion that survives sweat, salt, and UV for 8–12 years—only lab reports prove the claim.
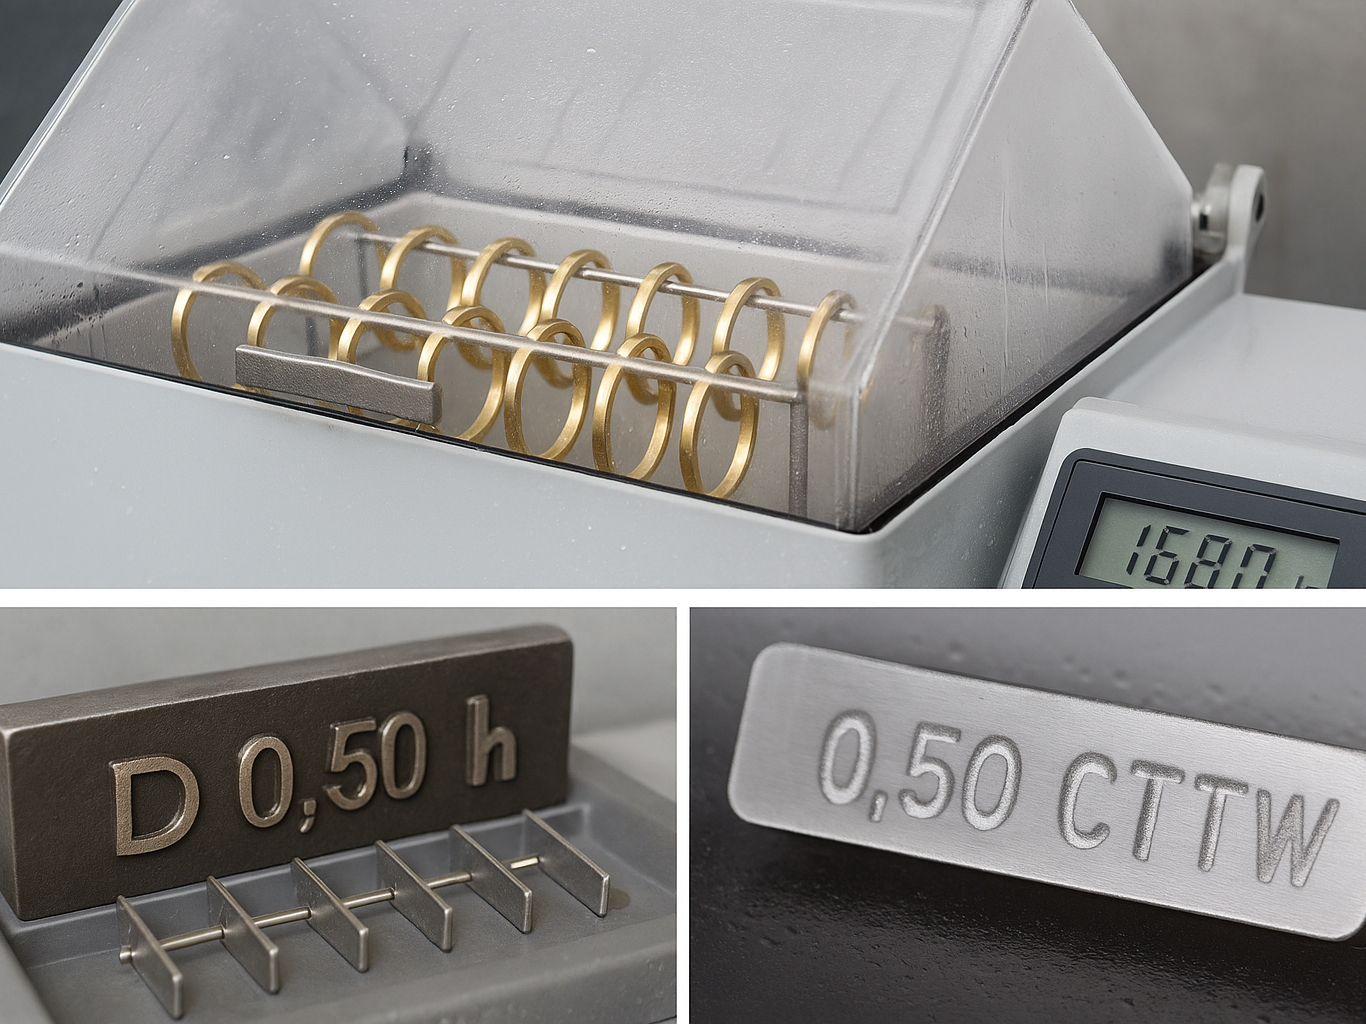
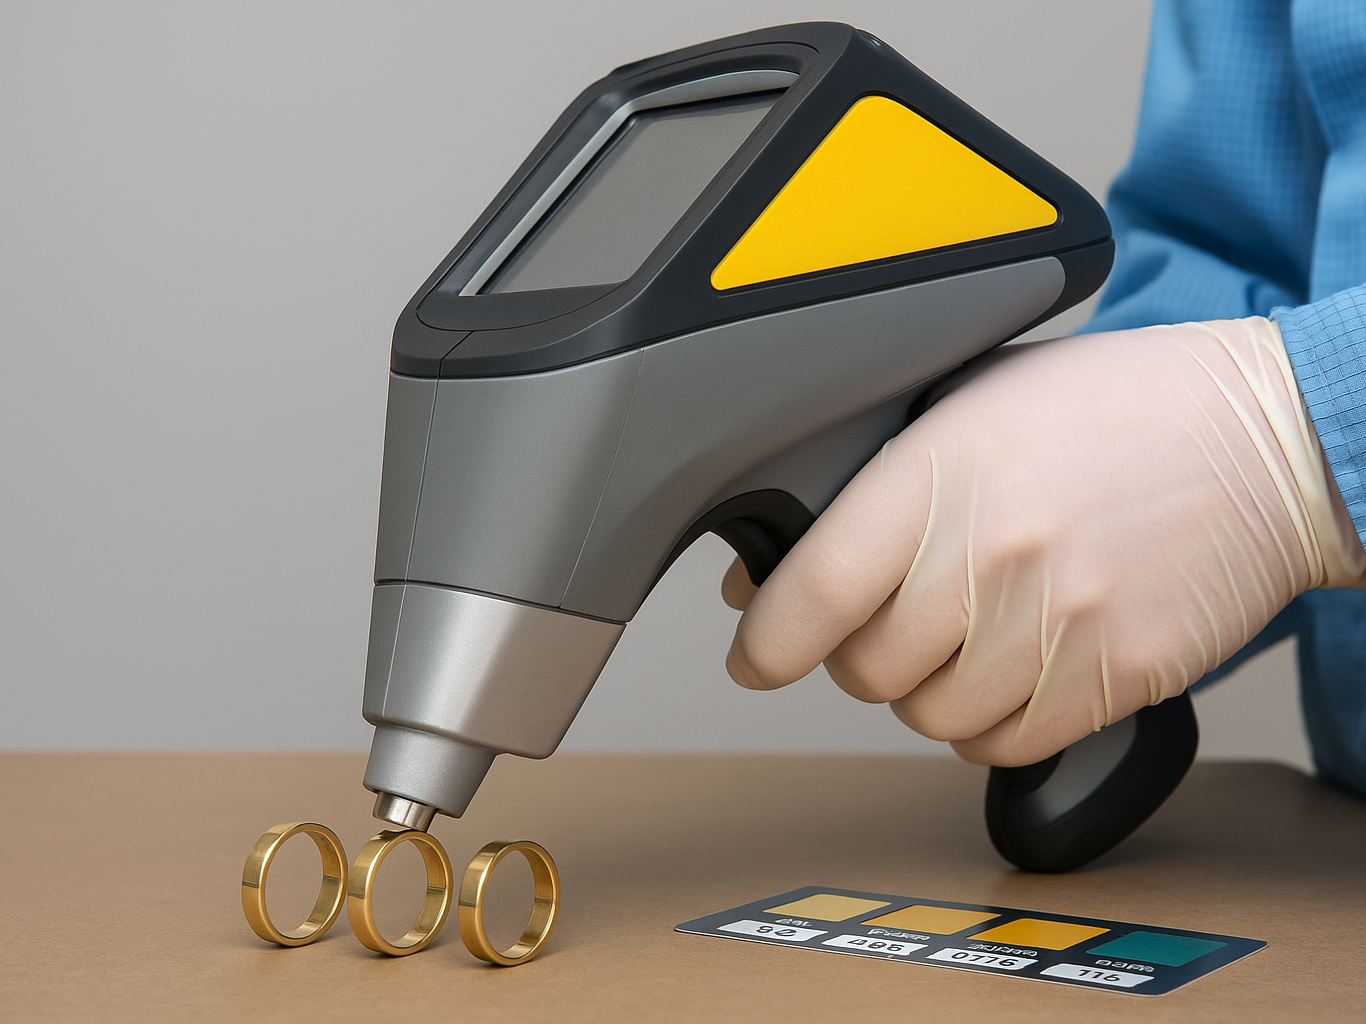
I keep a handheld XRF in the packing zone so every carton ships with measured layer data.
Which technologies create real non-tarnish gold?
Shiny ads talk about “everlasting” finish. I ask for microns and alloy charts.
Only two systems pass my salt-spray benchmark: ≥0.5 µm TiN-based PVD or gold alloyed with ≥1 % ruthenium/iridium.
Dive Deeper
H3 | Technology Comparison
| Method | Core Idea | Durability (Salt Spray h) | Cost ↑ |
|---|---|---|---|
| TiN/TiCN PVD ≥0.5 µm | Vacuum-bonded nitride skin | 1000–1500 | +18 % |
| Ruthenium Alloy 18 K | Noble metal solid solution | Permanent | +30 % |
| Rhodium Flash 0.1 µm | Electro-plated barrier | 200–400 | +12 % |
| Epoxy Nano-film | Clear polymer seal | 150–300 | +8 % |
H3 | Accelerated Aging Benchmarks
| Test | Standard | Pass Line | Kalen Result |
|---|---|---|---|
| Salt Spray | ASTM B117 | ≥168 h | 480 h no base metal |
| Sweat (pH 4.7) | EN 1811 | ≤0.5 µg/cm² Ni | 0.00 µg/cm² |
| UV Exposure | ISO 4892-2 | 500 h ΔE<1 | ΔE 0.4 |
Why does it boost a retailer’s bottom line?
My repair log used to show “tarnish polish” 18 times a week.
Zero-oxidation pieces cut finish returns to 0.4 %, lift display appeal, and save \~17 staff hours monthly.
Dive Deeper
H3 | Profit Impact Table
| Pain Point | Standard Gold | Non-Tarnish Line | Δ Impact |
|---|---|---|---|
| Finish Returns | 6.5 % | 0.4 % | +6.1 % revenue keep |
| Display Polishing Labor | 45 min/day | 5 min/day | –40 h/quarter |
| Price Mark-Down | –12 % after 6 mo | –1 % | +11 % margin |
Case example: Canada boutique switched 60 % catalog to PVD and logged \$38 k fewer returns in first year.
How can I verify durability claims before payment?
Marketing sheets mean little; I demand lab numbers.
Request XRF thickness files, ASTM B117 videos, and ISO 17025 reports—reject any batch lacking these proofs.
Dive Deeper
H3 | My Three-Step Audit
-
Document Check
- EN 10204 3.1 material cert
- SGS sweat-test sheet
-
On-Site Sampling
- XRF ≥0.5 µm PVD
- Adhesion cross-cut ASTM D3359 ≥4B
-
Environmental Simulation
- 48 h 35 °C / 85 % RH chamber
- <1 % mass loss target
| Verification Tool | Cap-Ex | Pieces/Hour | Fail-Catch % |
|---|---|---|---|
| Handheld XRF | \$32 k | 300 | 96 % |
| Salt Spray Cabinet | \$4 k | 50 (batch) | 98 % |
| Taber Abraser | \$1.2 k | 40 | 92 % |
I share the raw data with clients—transparency closes deals twice as fast.
Conclusion
Permanent shine is real when backed by microns, alloys, and lab reports—verify before you stock.